
This article on Europe’s Exposure to Hormuz related transport disruption was originally published in Current Economics: May 2026
The Long Road: Quantifying Europe’s Exposure to Hormuz-Related Transport Disruption
Yacine Rouimi and Mark Wall, Deutsche Bank Research Institute, London.
Heightened geopolitical risk in the Middle East has placed European transport networks under intense scrutiny, with a particular focus on the supply of jet fuel given the high share of the Gulf in the global supply of kerosene.
For the supply side of the European economy and overall input availability, the risk from a shortage of jet fuel is relatively small. The dominant fuel dependency for goods production is on diesel and electricity, reflecting the four-fifths share of input costs taken by land transport (road and rail).
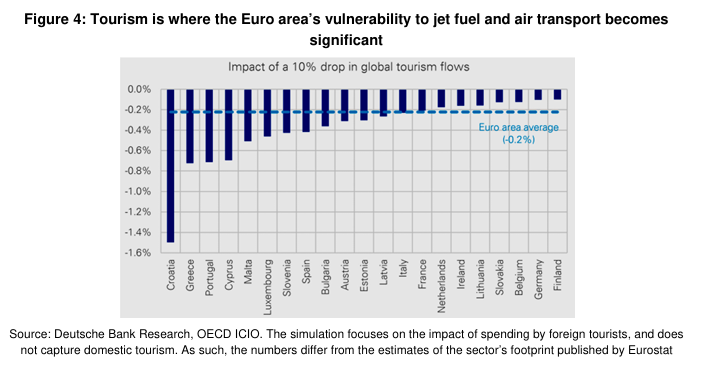
The true vulnerability to a shortage of jet fuel lies squarely with the tourism sector. Our simulation shows a 10% drop in tourism flows would have a moderate impact on the Euro Area, on average (-0.2% of GDP), but a more significant impact on countries like Croatia (-1.5%), Greece, and Portugal ( 0.7%).
Beyond the specific risk to jet fuel, a wider disruption to the global supply of transport would expose a more fundamental European vulnerability: the physical length of supply chains. To measure this vulnerability, we introduce a “physical distance travelled” metric, reflecting how far inputs travel for every industry. It reveals two critical points:
-
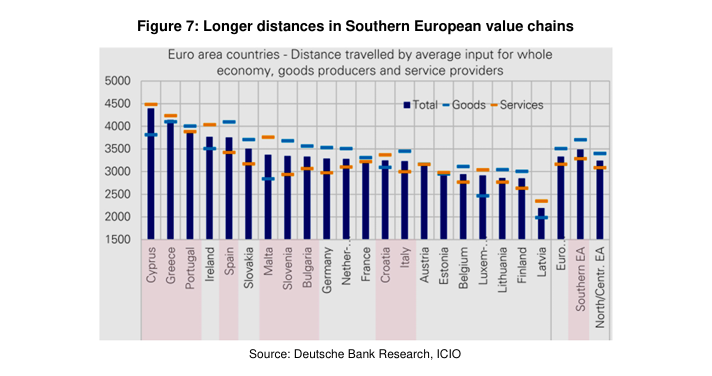
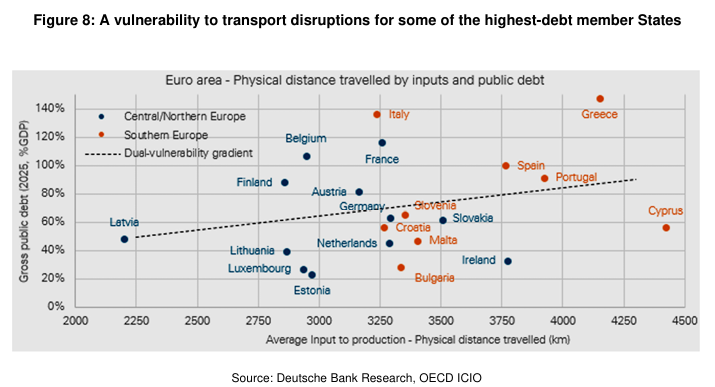
- A clear geographic divide: The economies with the longest supply chains are generally located in Southern Europe. Lacking deep integration with Europe’s industrial core their value chains are inherently more global and reliant on long-distance sourcing. This exposure to transport frictions could create a vulnerability for some of the zone’s high-debt member states. These countries are also those we previously found to have the highest energy import bill sensitivities.
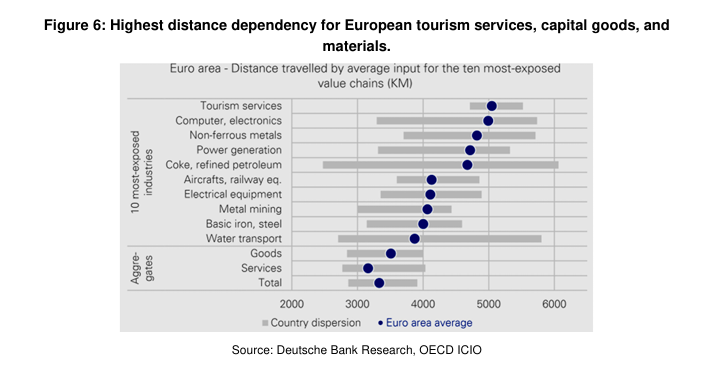
- A dual “hidden” risk: From a sector perspective, the most-exposed sectors besides tourism are capital goods (electronics, air/spacecraft, machinery) and materials manufacturing (metals, refineries), whose supply chains stretch nearly 5,000 km, on average. Crucially, these are the same value chains we previously identified1 as having high “hidden” energy content, indicating a dual vulnerability to both transport shocks and embedded energy costs.
What does this mean for the ECB? Our baseline view is a ‘measured’ tightening with 50bp of hikes to 2.50%, the upper end of the range of neutral. With the labour market cooling, financial conditions tightening and this threat of fuel shortages, the growth outlook is not robust enough to think the ECB hikes much beyond 2.50%. The challenge for the ECB could be fragmentation if fuel shortages have a differential impact on member states.
Concerns shifting from energy to transport. Aviation of particular concern. As we highlighted in a recent note,1 Europe’s economic exposure to the Gulf conflict is twofold, and is more complex than the singular energy shock of the Russia Ukraine war. Risks of direct shortages in energy and key materials like petrochemicals or mineral fuels are now coupled with a more complex threat: second-order disruptions to global value chains.
Transport disruption is one of the most significant vectors of transmission for both these risks. As an input at every stage of production, the transport sector’s resilience is once again at the forefront amid reports of looming fuel shortages and logistical bottlenecks.2 In all this, jet fuel is of particular concern, as shown by recent statements by the Head of the International Energy Agency on April 16 that Europe has “maybe six weeks of jet fuel left”,3 and our own calculations1 that the share of Gulf countries as a source for EU imports of kerosene reaches 56%.
As our transportation sector specialists explain, the market is already under pressure. Jet fuel prices have doubled, and while replacement barrels from the US and Africa have helped Europe plug the gap for now, this fragile balance is unlikely to survive the summer demand surge. Airlines are already cancelling unprofitable flights and face difficult trade-offs between raising prices and eroding consumer confidence.
In this article, we think about the European economy’s exposure to potential global transport disruption – in particular jet fuel – from two complementary perspectives. First, from a supply or production perspective, we look at the role of various forms of transport in European supply chains, including air transport, while introducing a distance metric reflecting how far European inputs travel and are exposed to transport disruptions. Second, from a demand or income perspective, we look at the exposure of European economies to tourism and in turn tourism’s exposure to air travel.
How much transport in value chains? 3-5% of inputs, of which little air transport. A traditional way to assess transport dependency is to measure its overall share in inputs along the value chain.
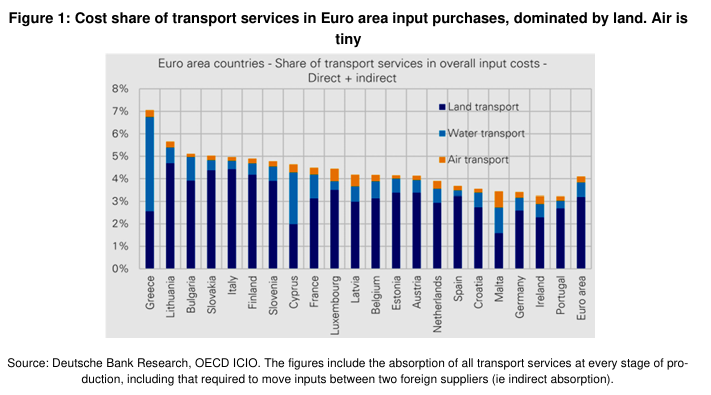
Our calculations, using a methodology popularized by the OECD,4 suggest transport services account for 3-5% of total input purchases across the Euro area (Figure 1), with some notable outliers like Greece at 7%. Among the Big4, the role of transport is more pronounced in Italy and France (4.5-5%), less so in Germany and Spain (3-4%).
Land transport constitutes the bulk of this transport cost – approximately four fifths. The share of water transport is significantly smaller, except for trade-reliant coastal nations like Greece, Malta, and Cyprus. Importantly, air transport represents only a minor share overall.
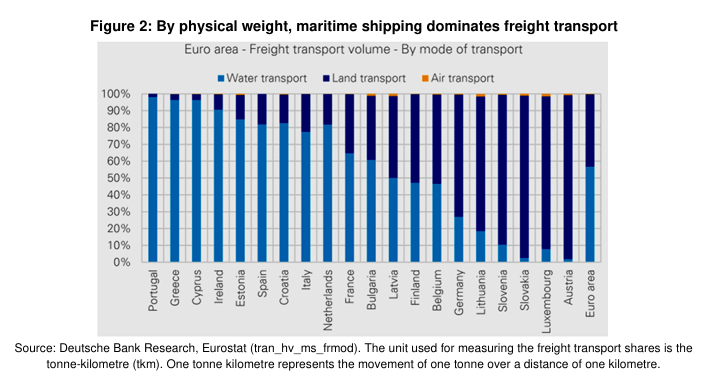
Implications for fuel usage. The dominance of land transport (i.e., road and rail) in the cost structure implies that the most significant fuel availability risk in the supply of goods and services comes from disruptions to diesel and electricity, not jet fuel. Given air freight’s minimal share in both costs and physical volume of freight (as confirmed by both our analysis and Eurostat data in Figure 2), even a severe, un-substitutable 10% shortage of jet fuel may not cause much disruption to the flow of inputs and economic production in Europe.
Tourism: a distinct, service-based vulnerability. The above numbers, focusing on freight and input purchases, do not capture the broader issue of the tourism economy: tourism involves moving individuals – not freight – and air transport is not counted as a formal input to the hotels, restaurants, and cultural activities that constitute the tourism economy (i.e., hospitality, recreation), but generally as a purchase by households.
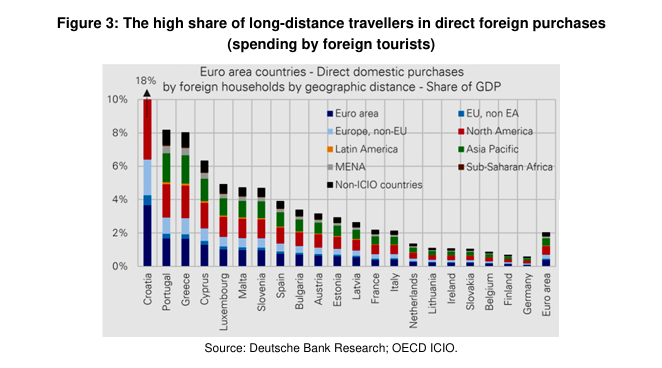
In Figure 3, we calculate the share of GDP driven by direct purchases by foreigners (spending by foreign tourists). The result, unsurprisingly, is that the nations of Southern Europe are much more exposed, on average, but all nations in Europe derive income from a demand perspective from far-away visitors. We estimate that about three quarters of that spending is made by foreigners having travelled more than 2,000 km (50% of the spending by travellers more than 5,000 km away, often placing them on another continent).
A simulated 10% drop in global tourism flows reveals a manageable cost for the Euro Area, on average (a 0.2% hit to GDP – Figure 4). The impact is more pronounced in Croatia (GDP falling 1.5%), and Greece and Portugal (both seeing declines of 0.7%). On the Big4 countries, Spain would be faced with the most significant loss (0.4%), while France, Italy (0.2%) and Germany’s (0.1%) exposures are more modest.
An important caveat to bear in mind: in cases of severe disruption of air travel, holidaymakers would likely travel more locally, which should reduce the size of a shock to the tourism industry. The overall impact will still depend on the size of the tourism sector relative to local demand.
Beyond jet fuel: Measuring exposures to transport friction. The focus on jet fuel, while critical for tourism, highlights a greater strategic risk: energy-driven transport disruptions may not stop at kerosene. A broader shock to transport fuels affecting diesel and maritime fuels would more certainly curtail the physical movement of goods. In such a scenario, what matters is not just the cost of transport, but a value chain’s fundamental exposure to distance.
To assess this exposure, we introduce the “physical distance travelled” metric. This measure goes beyond a simple ‘average import distance’ to quantify the total physical journey embedded in the Euro Area’s inputs to production, including domestic trade and all transactions that occur before a final good is imported. It reveals the true length – and vulnerability – of our supply chains. Deutsche Bank clients can access further details including the methodology on our Deutsche Bank Research5 client site.
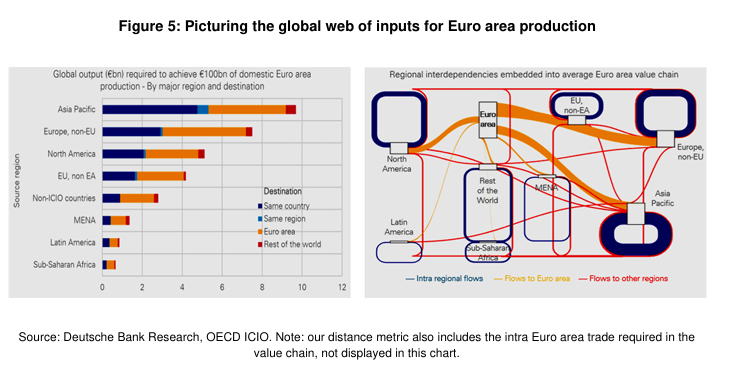
Figure 5 illustrates the main input to the calculations. It shows the global transactions required to generate e100bn of production of an average good/service in the Euro Area, and where this output is directed. Both charts contain the same data, with the left-hand one showing how output is broken down (domestic consumption vs. exports), while the right-hand one illustrates the complex connections across regions to feed the Euro Area with inputs. The blue and red links represent the Euro Area’s indirect exposure.
We find a significant reliance on external partners, requiring approximately e10bn in output from the Asia-Pacific region alone. The charts also highlight the complexity of these value chains: a large portion of the Asian output is transacted and transformed internally (the blue segments) before being exported.
Tourism is clearly at risk, while the capital goods and materials value chains stand out on the goods-producing side. Southern Europe is more vulnerable, too.
The distance metric we calculate is simply the sum of the distances between the nodes in Figure 5 in kilometres, weighted by their values (it also includes intra euro area trade, not displayed in the chart). It shows that the longest, and, therefore, most transport-exposed, value chains in the Euro Area fall into three clear categories:
- First are tourism services, with most countries deriving a significant portion of revenue from travellers residing more than 5,000 km away (Figure 6).
- Second, Capital goods, where production is globally fragmented. Here, the computer and electronics sector stands out, with the average input traveling nearly 5,000 km, the longest of any European industry, after tourism. Other capital goods sectors like aircraft/railway equipment and electrical equipment (4,100 km) also exhibit noticeably long supply chains.
- The third category is materials manufacturing. Industries like non-ferrous metals (4,800 km), coke/refined petroleum (4,700 km), and iron/steel (4,000 km) all rely on sourcing raw materials from distant global locations. Notably, these are the same value chains we previously identified as having a high “hidden energy”1 imported content, indicating a dual vulnerability to both energy shocks and transport disruption.
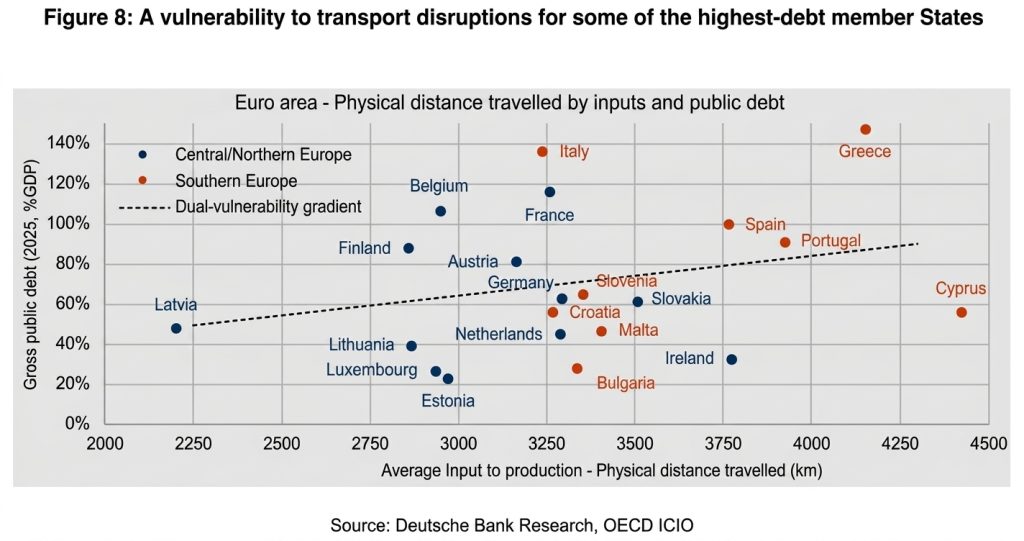
In terms of geographies, the simulations show that several Southern European countries have longer-than-average supply chains: a group including Cyprus, Greece, Portugal, and Spain are all positioned at the higher end of the spectrum (Figure 7). An average calculated for the nine Southern Euro area economies yields a kilometric distance of 3,490 km, a figure higher than the Euro Area average of 3,330 km. For goods producers within this southern bloc, the average distance is even longer, at 3,700 km.
The higher exposure to transport frictions could, therefore, create a vulnerability for some of the zone’s high-debt member states (Figure 8). These countries are also those we previously found to have the highest energy import bill sensitivities.
Italy and Croatia are exceptions to this pattern, showing shorter supply chain distances more aligned with the industrial core of the Euro area, like Germany and France (3,200-3,300 km).
What this means for the ECB: Measured tightening…at most
A negative supply shock pushes prices up and activity down. These opposing forces can neutralise the impact on monetary policy (‘look through’). The ECB is nervous that the size and persistence of the upside inflation shock might need a tightening of monetary policy to ensure that inflation remains anchored at 2% in the medium term. However, the downside risks to growth are not irrelevant. The more significant the downside risks to growth, the less likely is a large or persistent inflation shock. Monetary policy needs to carefully weigh the inflation effects against the growth effects.
If Europe suffers from an outright shortage of transport fuels, then growth will undoubtedly weaken more than expected (assuming no substitutability of fuels or other sources of transport). Shortages could also push transport prices up even more, but only if firms believe demand can sustain even sharper price hikes, and this cannot be taken for granted – especially when the fiscal response to the crisis is limited and financial conditions are tightening.
In other words, if fuel supply shocks intensify to the point of outright shortages in Europe, it is not obvious that monetary policy would have to tighten even more than expected. It is even possible that monetary policy tightens less.
Our view is that the downside risks to growth are becoming more significant. One reason is the impact of the energy shock on supply chains. As discussed above, there are multiple aspects to this shock on supply chains.
First, we recently wrote about the hidden energy costs in Europe’s imports, particular from Asia, a region where the risk of production disruptions from energy shortages is more acute.
Second, last year, we wrote about the high complexity (and low substitutability) of Europe’s imports from Asia (China in particular). This increases the risk of an Asian shock compromising European supply chains.
Third, in this note, we offer a complementary perspective by showing the actual length (‘physical distance travelled’) of Europe’s supply chains. The member states most at risk of an economic cost from a limited supply of transport fuels are those with longer supply chains. Generally speaking, they are also the ones with higher levels of public debt.
The bottom line is we see the net inflation/growth arguments favouring a measured ECB tightening at most. Our baseline is 50bp of hikes to 2.50%, with quarter point hikes in June and September. With the labour market cooling, financial conditions tightening and a threat of fuel shortages, the growth outlook is not robust enough to think the ECB hikes much beyond 2.50%. The challenge for the ECB could be fragmentation if fuel shortages have a differential impact on member states.
The original piece: The long road: Quantifying Europe’s exposure to transport disruption – Deutsche Bank Research Institute
Notes:
1 Yacine Rouimi and Mark Wall, ‘Beyond the barrel: Europe’s hidden energy vulnerability’, Deutsche Bank Research Institute, April 14, 2026, https://www.dbresearch.com/PROD/IE-PROD/PDFVIEWER.calias?pdfViewerPdfUrl=PROD0000000000624071&rwnode=REPORT
2 Seher Dareen, Robert Harvey and Ahmad Ghaddar, ‘Europe’s jet fuel imports from Middle East stop, raising supply crunch fears’, Reuters, April 28, 2026, https://www.reuters.com/business/energy/europes-jet-fuel-imports-middle-east-stop-raising-supply-crunch-fears-2026-04-28/
3 Theo Leggett and Jemma Crew, ‘Europe has ‘maybe six weeks of jet fuel left’, energy boss warns’, BBC News, April 16, 2026, https://www.bbc.co.uk/news/articles/czjw2kz0l22o
4 ‘Trade in value-added’, OECD, https://www.oecd.org/en/topics/sub-issues/trade-in-value-added.html
5 Deutsche Bank Research, https://research.db.com/research/Register