
Asia Pacific 2025 Forecast Accuracy Award Winners
Recognising professional forecasters whose GDP growth and consumer price inflation predictions proved most accurate over the full forecasting cycle.
Within February-April 2026 Consensus Economics, the world’s leading economic survey organization announced the winners of its 2025 Asia Pacific Accuracy Award. This program recognises the achievements of leading economic forecasters who most accurately predicted the final outturns of GDP growth and Consumer Price Inflation in the economies they followed for the year 2025. Winners vary from year to year and across variables, due to exogenous shocks, data surprises and cyclical and structural adjustments. See our methodology description below for more details.
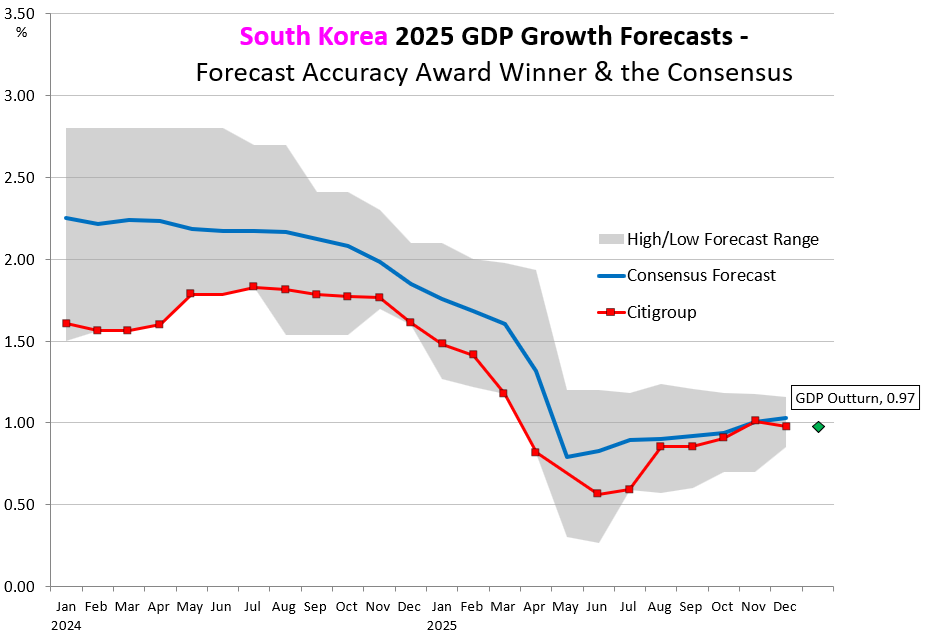
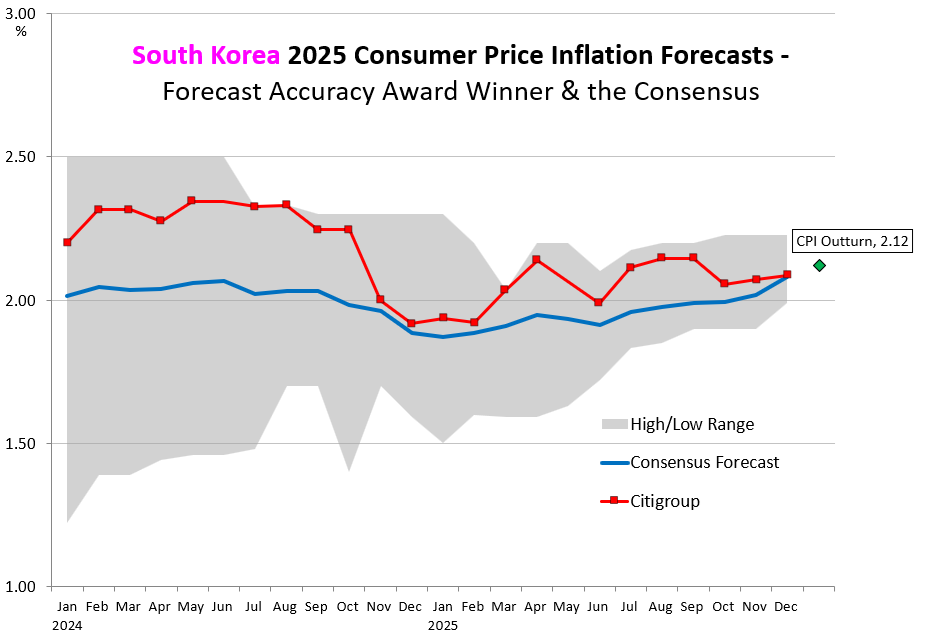
2025 Asia Pacific Consensus Economics Forecast Accuracy Award Winners
| Country | Company | Economists |
| Australia | Societe Generale | Societe Generale Economics Team |
| China | Eaton Corporation | Joseph McKenna and Austin Farley |
| Hong Kong | Nomura | Harrington Zhang and Ting Lu |
| Indonesia | Barclays | Brian Tan |
| Japan | JP Morgan | Ayako Fujita, Benjamin Shatil and Takuho Morimoto |
| Malaysia | Citigroup | Kit Wei Zheng |
| New Zealand | ASB Bank | ASB Economics Team |
| Philippines | JP Morgan | Jin Tik Ngai |
| Singapore | Oxford Economics | Sheana Yue |
| South Korea | Citigroup | Jin-Wook Kim |
| Taiwan | Nomura | Jeong Woo Park and Si Ying Toh |
| Thailand | Nomura | Euben Paracuelles |
| Vietnam | DBS Bank | Chua Han Teng |
Consensus Economics collects forecasts from over 1,000 economists around the world each month. It was founded in 1989 to measure and record consensus expectations, which are seen as macroeconomic forecast benchmarks by investment and planning managers, as well as government and public sector institutions, who find the Consensus data useful, timely and accurate.
How the Forecast Accuracy Awards are determined.
The awards use a consistent error-based test across the full forecasting cycle. Smaller forecast errors indicate greater accuracy.
MAE compares each forecast with the eventual official outturn and measures the size of the error, regardless of whether the forecast was too high or too low.
Forecasts tested
Monthly real GDP growth and consumer price inflation forecasts are assessed over the 24-month forecasting cycle for 2025.
Official outturns
The forecasts are compared with the subsequently published official GDP and inflation estimates for each economy.
Absolute errors
The difference between each forecast and the outturn is measured in absolute terms, so over- and under-estimation are treated equally.
Overall accuracy
GDP and inflation error scores are combined to identify the panellist with the lowest overall error across the testing period.
Qualification
Panellists must participate consistently through the forecasting cycle so that the comparison rewards sustained forecasting performance.
Read the full methodology note
Asia Pacific Consensus
The Forecast Accuracy Awards were determined using Mean Absolute Error analysis. The errors measured were the differences between the panellist’s forecasts and the actual data outturns. The forecaster with the lowest average error rate was deemed to have been the most accurate over the testing period.
The Forecasts Used The forecasts we examined were our panellists’ monthly survey contributions for 2025 Real GDP Growth and 2025 Consumer Price Inflation (CPI) expectations (annual average % change). We began collecting these forecasts in January 2024, and the 24 month forecasting cycle ended in December 2025, providing 24 monthly data points to test for each variable.
The Outturns Used The outturns we used as a comparison to the forecasts were the official estimates of 2025 GDP and CPI, which were released between January and April 2026, depending on the country and variable concerned.
The Calculation When calculating the error (the difference between the forecast and the outturn) we looked at the absolute errors, ignoring sign, as errors resulting from over-estimation and under-estimation are equivalent. We then calculated the mean average absolute error for the forecasts of each panellist for both GDP and CPI over the 24 month forecasting period.
Establishing the Most Accurate Forecaster To determine the most accurate forecaster for a given year, we added the mean absolute error rates for GDP and Inflation to identify the panellist with the lowest overall error rate. Smaller errors are best when considering accuracy, and to win the award requires the panellist to have exhibited a strong forecasting performance across both GDP and Inflation variables over the 24 month forecasting horizon.
Qualification To be considered for the award, a panellist needed to have participated consistently in our monthly surveys over the 24 month forecasting period. This ensured that no panellist gained an advantage through non-participation, or by only providing forecasts nearer the end of the 24 month cycle, when the steady release of official data can assist forecasters in making revisions.