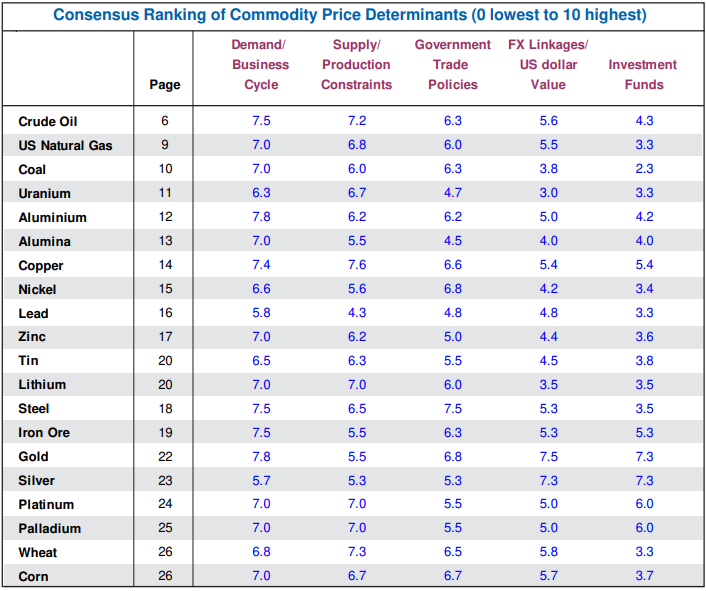
In this month’s special survey, we asked our commodities panellists and other economists to rank the current importance of a range of different factors ( ‘Demand/Business Cycle’, ‘Supply/Production Constraints’, ‘Government Trade Policies’, ‘FX Linkages/US dollar value’ and ‘Investment Funds’) in determining price movements. Scores were assigned to each of the factors on a scale of 0 (no influence) to 10 (very strong influence). The consensus results are the averages of individual panellists’ scores for each factor. Given that different commodities are influenced by a wide range of factors, we limited the variables considered to a common list of five factors which we asked our panellists to assess for relative importance.
 |
 |
|
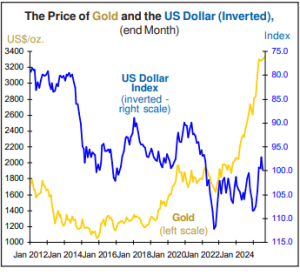
Commodity prices are often volatile, influenced by a complex combination of factors that vary in importance depending on the specific commodity and the time period. In our updated annual survey on Factors Affecting Commodity Prices, we asked our panelists to compare and rate the sensitivity of various commodity prices to a range of influences. These include “Demand/Business Cycle”, “Supply/Production Constraints”, “Government Trade Policies”, “FX Linkages/US dollar Value”, and “Investment Funds”. Since these factors can often work in opposing directions, this survey (the results of which are presented in the table above) also aims to identify which influences are likely to be most dominant. Since the start of this year, global commodity markets have been on a roller coaster. Much of the turbulence stems from US tariff risks, with the Trump administration’s “Liberation Day” tariffs launched in April upending global trade dynamics. Countries scrambled to strike new deals with Washington, amplifying uncertainty. It is unsurprising therefore that ‘Government Trade Policies’ is rated highly as a factor influencing the price of most commodities. Specific US tariffs targeting commodities like aluminium, steel and copper have heavily impacted price movements in base metals. A last minute decision by Washington to leave out refined copper and concentrate from its tariff on copper sent prices plummeting on COMEX. Beyond trade, monetary policy and currency shifts also matter. A likely US rate cut in September could weaken the dollar, making dollar-priced commodities cheaper in local terms. Meanwhile, traditional factors such as demand and supply continue to have significant influence over commodity prices. The Chinese economy continues to shape commodity demand expectations. Yet saddled with a weak property market, the Asian giant is struggling to reinvigorate its economy amid soft domestic demand fundamentals. The slowdown in the construction sector is driving lower demand for iron ore, while a trade war with the US earlier this year stoked fears that it would further zap Chinese demand for industrial metals. Since then, a tariff truce with the US has calmed trade tensions, but surplus capacity has contributed to deflation. Unable to sell to the domestic market, Chinese producers are offloading surplus steel abroad, contributing to global oversupply. Similarly, prices for nickel have collapsed as Chinese-owned Indonesian mines flooded the market with the metal. The three graphs on this page illustrate the relationships between commodity prices and various explanatory factors. The first graph compares the price of gold (US$/oz.) with the US dollar DXY Index. Gold is often viewed as a long-term hedge against a weaker dollar, leading to a typically negative correlation (the US dollar Index is plotted on an inverted scale). However, the relationship is not rigid and short-term divergences from this trend are not uncommon due to influences from various factors such as interest rates, inflation and geopolitical risks. Much of the impetus behind gold’s continued ascent comes from safe haven demand as geopolitical risks and economic uncertainty fuelled by US trade policies sparked a rush to safe haven assets. Additionally, gold remains in high demand amongst central banks given the still-uncertain economic climate, its enduring appeal as a hedge against inflation as well as reflecting a general drive to diversify away from the US$. There is also evidence of a shift away from US assets by investors, with this trend fuelled by erratic US policymaking, questions over US Fed independence and aggressive US trade policy. The second graph examines the traditional price link between Crude Oil (WTI) and US Natural Gas, both of which can serve as substitutes in power generation. Prices for both commodities spiked in the wake of the Ukraine conflict, but more than three years on, prices have trended lower after markets adjusted to the initial supply shock. Since 2022, the EU has diversified away from Russian energy supplies, sourcing its energy needs from the likes of the US and Qatar. Up until January 1, the bloc was still receiving Russian gas flows via Ukraine, but with this having ended competition for LNG will likely intensify as Europe competes with regions like Asia for LNG cargoes. Even as natural gas prices face bullish pressure, crude prices are expected to turn more bearish going forward. Since April this year, OPEC+ has been unwinding its oil supply cuts, with the group accelerating its output hikes in the summer to recapture market share. Weaker global growth (undermined by US tariffs) and perhaps a slower US economy have raised concerns that the oil market will be facing a supply glut later this year. Finally, the third graph compares the S&P 500 Index with the Economist Base Metals Index, traditionally reflecting the close relationship between the business cycle and base metals prices. After dipping sharply in the aftermath of Trump’s tariff announcement in April, the S&P 500 Index has recovered lost ground to exceed the level at the start of the year, helped by resilient corporate earnings, lower tariff rates and US rate cut expectations. Even signs of a tariff driven slowdown in US activity failed to dent investor optimism. By contrast the Economist Base Metals Index has experienced an increase in volatility, driven partly by tariff-related distortions and as global supply chains face disruptions.
|
|
| DOWNLOAD A RECENT COPY OF ENERGY, METALS & AGRICULTURE | |